
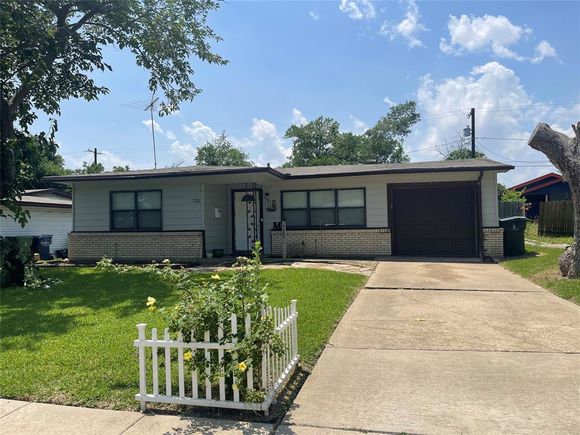
722 E Ridgewood Drive
Garland, TX 75041
- 4 beds
- 2 baths
- 1,854 sqft
- 7,187 sqft lot
- $129 per sqft
- 1956 build
- – on site
More homes
WELCOME HOME! The perfect place for family and friends to gather. The kitchen seamlessly opens to the living area. Enjoy stylish storage with beautiful built-in shelving. The primary suite features direct access to the patio, offering a private retreat. An additional room can serve as a dining area, office, or bonus room. The spacious backyard is perfect for pets, kids, and adults alike. Conveniently located near schools, shopping, restaurants, and easily accessible highways. Seller is selling as Is.
![]()
Last checked:
As a licensed real estate brokerage, Estately has access to the same database professional Realtors use: the Multiple Listing Service (or MLS). That means we can display all the properties listed by other member brokerages of the local Association of Realtors—unless the seller has requested that the listing not be published or marketed online.
The MLS is widely considered to be the most authoritative, up-to-date, accurate, and complete source of real estate for-sale in the USA.
Estately updates this data as quickly as possible and shares as much information with our users as allowed by local rules. Estately can also email you updates when new homes come on the market that match your search, change price, or go under contract.
![]() Checking…
•
Last updated Apr 6, 2025
•
Checking…
•
Last updated Apr 6, 2025
•
MLS# 20636602 —
The Building
-
Year Built:1956
-
Structural Style:Single Detached
-
Accessibility Features:No
-
Basement:No
-
Foundation Details:Slab
-
Levels:One
Interior
-
Interior Features:Cable TV Available, High Speed Internet Available
-
Flooring:Ceramic Tile, Laminate
-
# of Dining Areas:1
-
# of Living Areas:1
Room Dimensions
-
Living Area:1854.00
Location
-
Directions:use GPS
-
Latitude:32.88870300
-
Longitude:-96.62282700
The Property
-
Property Type:Residential
-
Property Subtype:Single Family Residence
-
Property Attached:No
-
Parcel Number:26353500130200000
-
Lot Size:Less Than .5 Acre (not Zero)
-
Lot Size SqFt:7187.4000
-
Lot Size Acres:0.1650
-
Lot Size Area:0.1650
-
Lot Size Units:Acres
-
Fencing:Wood
-
Will Subdivide:No
Listing Agent
- Contact info:
- No listing contact info available
Taxes
-
Tax Lot:20
-
Tax Block:13
-
Tax Legal Description:MONICA PARK 2 BLK 13 LT 20
Beds
-
Bedrooms Total:4
Baths
-
Total Baths:2.00
-
Total Baths:2
-
Full Baths:2
The Listing
Heating & Cooling
-
Heating:Central
-
Cooling:Central Air
Utilities
-
Utilities:City Sewer, City Water
Appliances
-
Appliances:Gas Range
Schools
-
School District:Garland ISD
-
Elementary School:Choice Of School
-
Elementary School Name:Choice Of School
-
Middle School Name:Choice Of School
-
High School Name:Choice Of School
The Community
-
Subdivision Name:Monica Park 02
-
Pool:No
-
Association Type:None
Parking
-
Garage:No
-
Parking Features:Converted Garage, Garage Faces Front
Walk Score®
Provided by WalkScore® Inc.
Walk Score is the most well-known measure of walkability for any address. It is based on the distance to a variety of nearby services and pedestrian friendliness. Walk Scores range from 0 (Car-Dependent) to 100 (Walker’s Paradise).
Bike Score®
Provided by WalkScore® Inc.
Bike Score evaluates a location's bikeability. It is calculated by measuring bike infrastructure, hills, destinations and road connectivity, and the number of bike commuters. Bike Scores range from 0 (Somewhat Bikeable) to 100 (Biker’s Paradise).
Transit Score®
Provided by WalkScore® Inc.
Transit Score measures a location's access to public transit. It is based on nearby transit routes frequency, type of route (bus, rail, etc.), and distance to the nearest stop on the route. Transit Scores range from 0 (Minimal Transit) to 100 (Rider’s Paradise).
Soundscore™
Provided by HowLoud
Soundscore is an overall score that accounts for traffic, airport activity, and local sources. A Soundscore rating is a number between 50 (very loud) and 100 (very quiet).
Air Pollution Index
Provided by ClearlyEnergy
The air pollution index is calculated by county or urban area using the past three years data. The index ranks the county or urban area on a scale of 0 (best) - 100 (worst) across the United Sates.